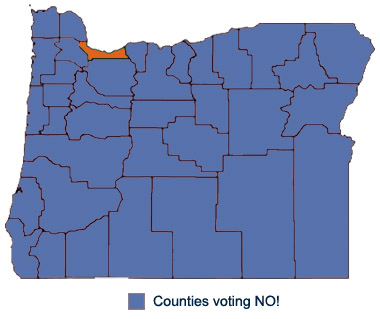
You defeated ballot measure 88 - PODL was a great success
You did it! You defeated Ballot Measure 88!
 Your support of the Protect Oregon Drivers Licenses campaign was invaluable. First and foremost, 66%, or nearly a million Oregon voters, VOTED NO on Ballot Measure 88 in the November 2014 election preventing illegal aliens from obtaining a state issued photo ID in the form of a driver privilege card here in Oregon. Thirty five of thirty six Oregon counties defeated Ballot Measure 88.
If you would like to arrange for a guest speaker from Oregonians for Immigration Reform - Protect Oregon Driver Licenses to address your organization at an upcoming meeting or at your next special event. Please submit your request via our general contact form.
If you are a member of the media and wish to contact us, please use our media contact form.
How Oregon Counties Defeated Ballot Measure 88
The Oregon Secretary of State reporting the following votes by county on November 4, 2014. A no vote was a vote to defeat Ballot Measure 88 and to support Protect Oregon Drivers Licenses.
| County | Yes | No | Total |
| Baker | 15.80% | 84.20% | 7,147 |
| Benton | 45.30% | 54.70% | 37,027 |
| Clackamas | 28.77% | 71.23% | 152,146 |
| Clatsop | 29.87% | 70.13% | 13,312 |
| Columbia | 20.53% | 79.47% | 19,945 |
| Coos | 21.32% | 78.68% | 23,733 |
| Crook | 15.78% | 84.22% | 8,999 |
| Curry | 22.49% | 77.51% | 9,671 |
| Deschutes | 29.25% | 70.75% | 67,417 |
| Douglas | 16.80% | 83.20% | 40,961 |
| Gilliam | 16.33% | 83.67% | 888 |
| Grant | 12.99% | 87.01% | 3,273 |
| Harney | 13.09% | 86.91% | 2,995 |
| Hood River | 43.44% | 56.56% | 8,260 |
| Jackson | 27.88% | 72.12% | 79,488 |
| Jefferson | 19.70% | 80.30% | 6,903 |
| Josephine | 17.99% | 82.01% | 33,589 |
| Klamath | 15.95% | 84.05% | 22,844 |
| Lake | 12.92% | 87.08% | 3,219 |
| Lane | 38.20% | 61.80% | 142,018 |
| Lincoln | 31.07% | 68.93% | 19,502 |
| Linn | 18.60% | 81.40% | 43,364 |
| Malheur | 17.51% | 82.49% | 7,531 |
| Marion | 27.37% | 72.63% | 101,981 |
| Morrow | 16.68% | 83.32% | 3,189 |
| Multnomah | 55.25% | 44.75% | 282,640 |
| Polk | 26.54% | 73.46% | 30,345 |
| Sherman | 12.05% | 87.95% | 888 |
| Tillamook | 28.78% | 71.22% | 10,609 |
| Umatilla | 19.82% | 80.18% | 19,123 |
| Union | 18.84% | 81.16% | 10,221 |
| Wallowa | 19.41% | 80.59% | 3,622 |
| Wasco | 25.10% | 74.90% | 9,069 |
| Washington | 33.91% | 66.09% | 188,565 |
| Wheeler | 15.18% | 84.82% | 705 |
| Yamhill | 26.33% | 73.67% | 36,119 |
| Totals: | 33.83% | 66.17% | 1,451,308 |
You can print the above votes by county.
